How Low is Too Low for R2
Why This Article?
Over the last few months, I have been keenly following the rigor with which the healthcare community is conducting clinical studies during the current pandemic. I was contrasting this with the more free-style approach that we in the industrial data science community use in proving out our models and deploying them. While the stakes are arguably lower, the impact of even a simple mistake can be similar- the performance of your AI model in the lab will not be reproducible in the field. This article series is an overview of common mistakes that I have noticed practitioners in the industrial sector commit while building machine learning models and how to avoid them. I hope you will find this article useful if you are:- A subject matter expert in the industrial sector and are looking to move towards building a career in data science
- An executive charged with generating ROI from digital programs
- An industrial data science expert looking to validate your own experience.
- Management of machine learning models throughout their lifecycle
- Building end-to-end data integration pipelines from raw data ingestion to analytic output delivery
- Optimization of your models without impacting their generalizability
- Rinse and repeat design patterns that scale to all of your data across the varying modalities, volumes, and velocities.
- How do you and your business leaders decide if your model is worth taking to the field?
- Will your model live up to its lab performance in the field?
- How do you combine your model with legacy reasoning tools or human intelligence to provide the best possible outcomes to your business?
Issue One: R2 – How low is too low?
If you have data science colleagues in the digital world, you would have noticed with envy how easy it is for them to prove the impact that their models are generating. For them, graduating a model, from the lab, to an A/B testing environment and on to production when proven, is a run of the mill operation. For example, if you believe you have a better recommendation engine, you deploy it on a portion of your web traffic and compare its performance to the previous model. If more people are clicking on your recommendations, then your model will be in production within no time! Simple. Unfortunately, our non-digital world is much more complex. Before you get an approval to take your model from lab to the field where it will start impacting the business, you will be asked the question: Is your model field worthy? Let us focus on this question using a machine learning performance metric R2. R2 is the standard metric in machine learning regression problems and is defined as “the proportion of the variance in the dependent variable that is predictable from the independent variable(s).” The higher R2, the better the model is. Ideally, you would want all your output variability captured by your model with R2 of 1. However, in industrial data science, you will very often be limited by the quality of datasets. The phenomenon you are trying to model may have too many external dependencies that are not captured by your data. The high-frequency data sources may have been down-sampled significantly before they were written to storage. The current sensing systems on your equipment are not designed for advanced analytic use cases. Often, you will end up with a model that provides only a partial explanation of your outputs. You will end up debating with your business users on whether it improves the status quo at all. An obvious question arises. What is a good enough R2 to warrant deploying the model in production? Is there an obvious value of R2 where the model should be discarded? I have noticed many data scientists interpret R2 as if it were a statistics test where a model is rejected when an R2 threshold is not met. This is possibly inspired by the analogue of statistical testing where you reject the null hypothesis if p-value is less than the significance level. However, the correct answer is, it depends. Whether the model is useful or not is dependent on the business problem we are solving.A Small Contrived Example
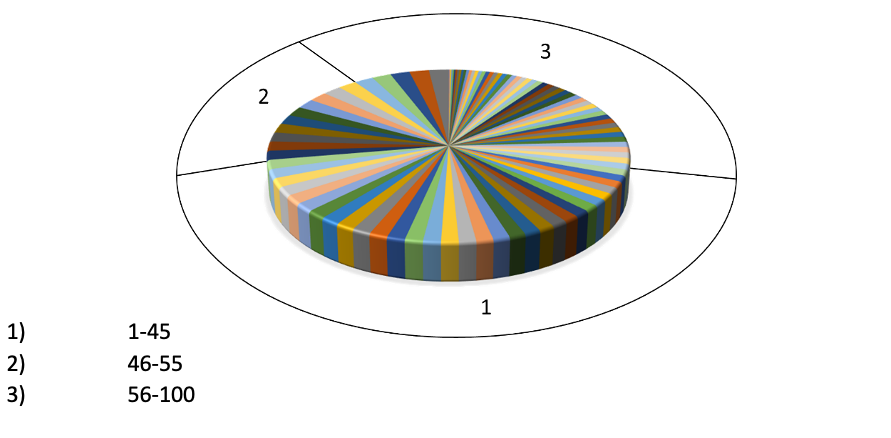
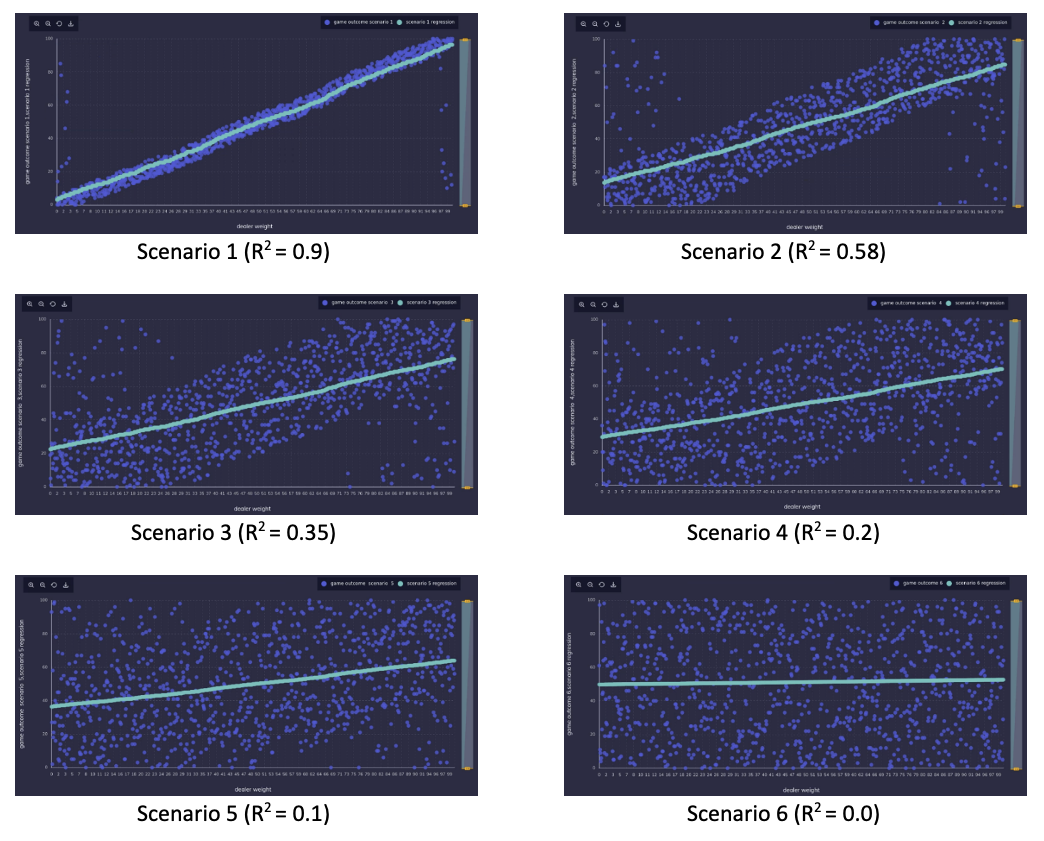
Let me explain with an example of a contrived game of chance. While the example is R2 focused, the same ideas apply for other model performance metrics like accuracy, F2 score, adjusted R2 etc. You are playing a game similar to roulette. You bet on where a ball will land on a spinning wheel that has 100 numbers, partitioned into three categories as follows.


Your Problems are not Constant
Businesses typically consider their problems as a given and data science projects as a tool that either succeeds or fails in solving this prescribed, constant problem. However, they leave value on the table by doing this. Optimal use of your analytic models might require you to adapt your business strategy and, in some cases, completely change your business model.A Small Contrived Example
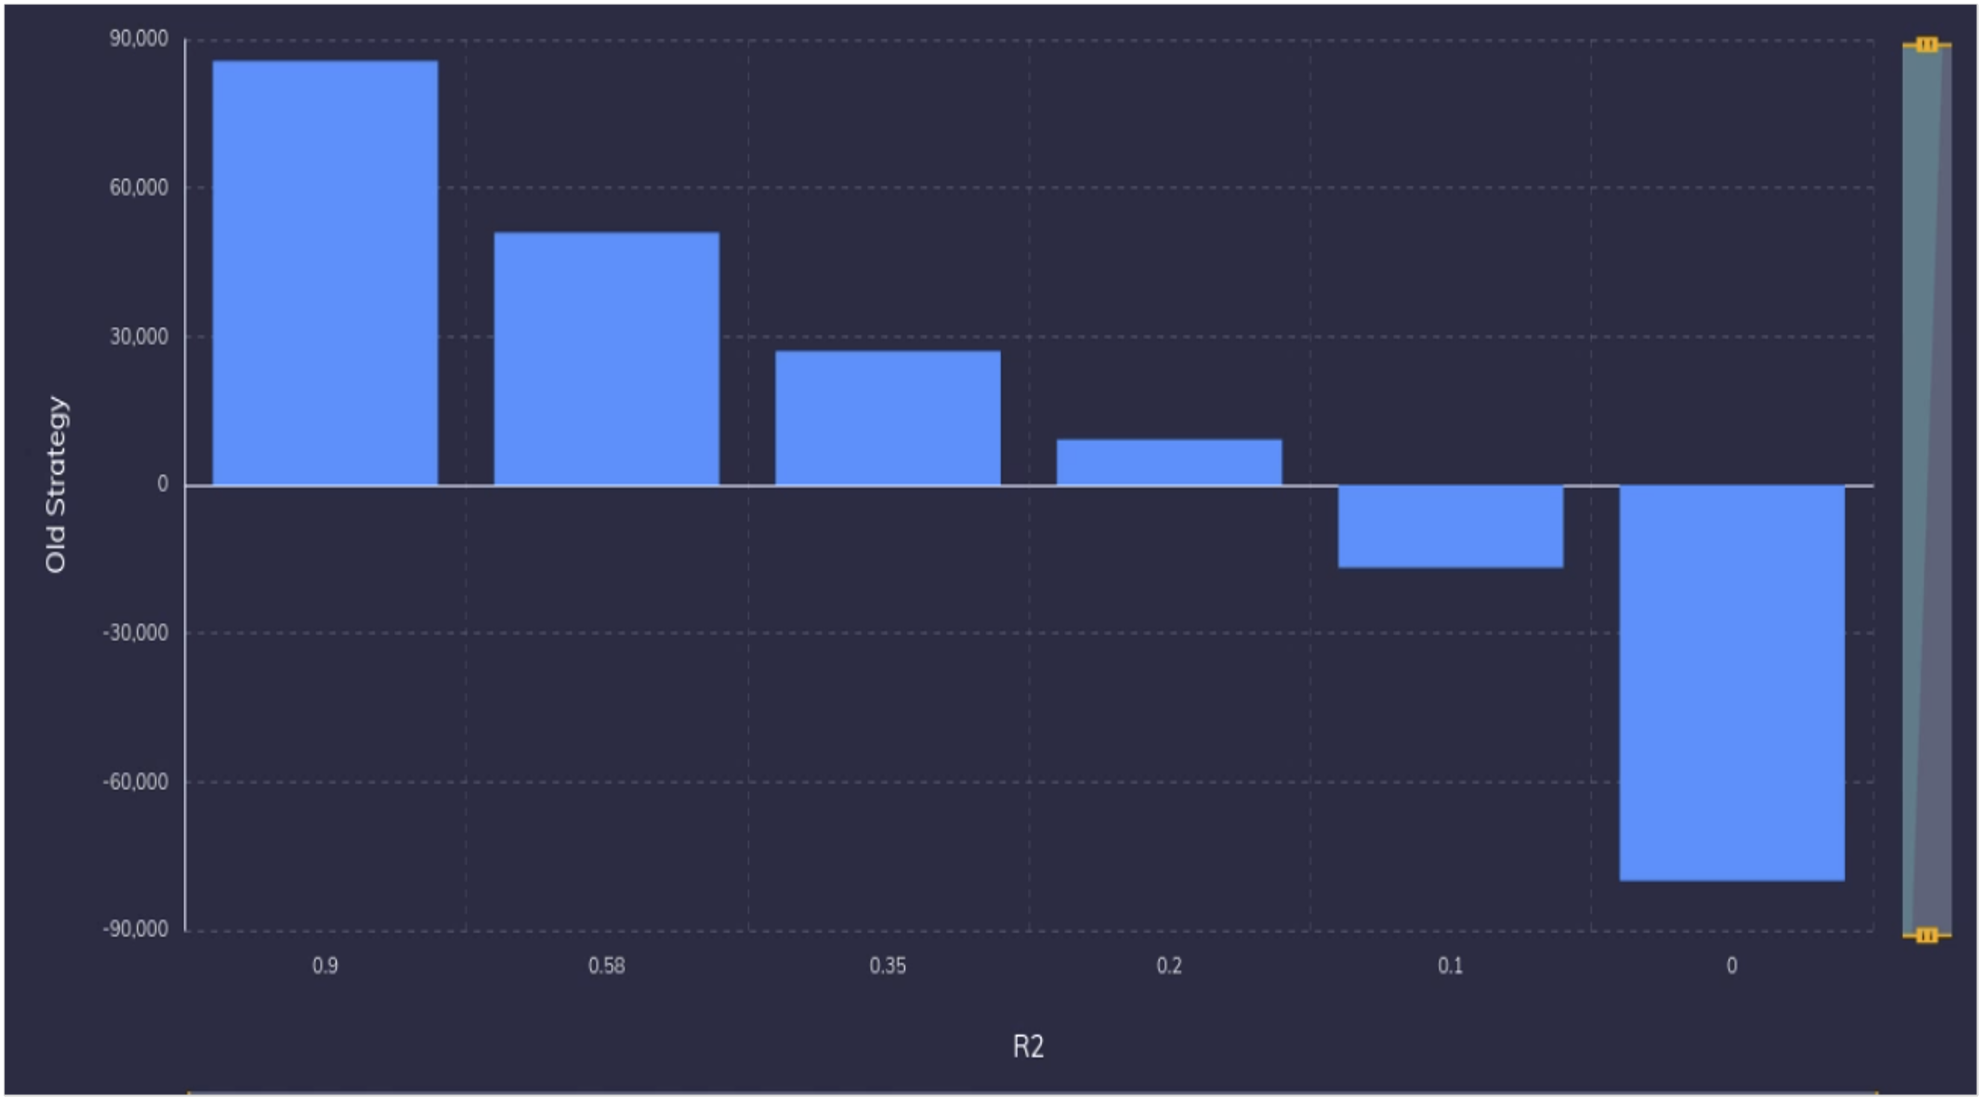
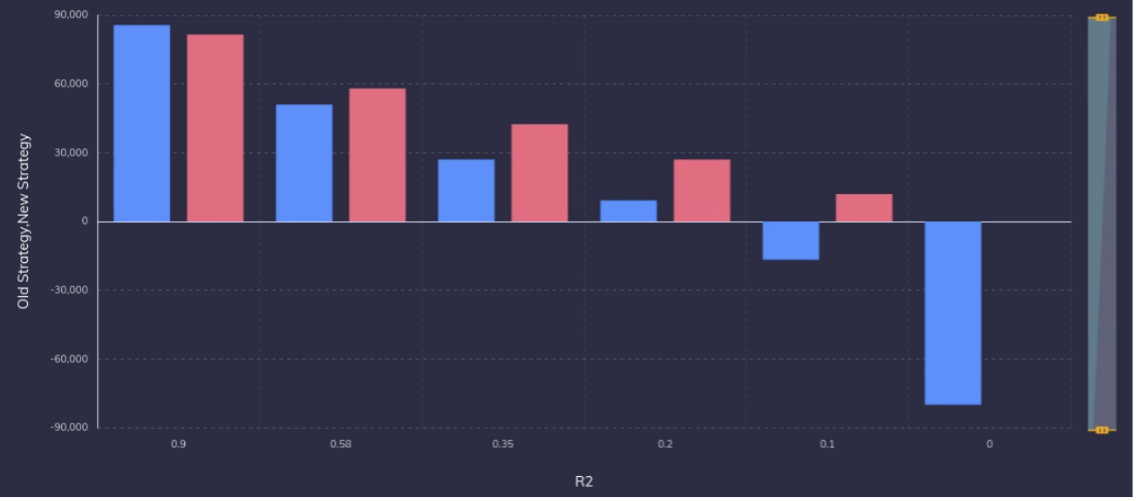
In the roulette game, we started losing money when our models have an R2 of 0.1 or less. Let us try to change our strategy a bit. Say you noticed that when the model predicts category 2, it is highly likely to be wrong. So, you change your strategy as follows – When the model predicts category 2, you do not bet on the game. Figure 2 shows the returns in all the six scenarios between the old and new strategy. Now, you will make money even at a R2 of 0.1. So, by adapting your strategy, you converted your “bad model” to a useful model. In fact, except for the first model, this strategy will net you more money for all other instances than the first strategy. So, except in the first exceptional case, your business will benefit by changing your strategy of playing the game.
- Complex models – Maybe you should add more layers to your network model?
- Feature engineering – Maybe you should start normalizing the differential pressure with input pressure and retrain?
- More creative data partitioning – How naïve of you to expect the model capture this failure mode when it never saw this in training data. Maybe, you should swap this portion?
- Business Strategy: My model is not good enough to shift completely to a predictive maintenance strategy. But is it good enough to reduce the frequency of our planned maintenance?

